M5.0 earthquake near Pinnacles, CA
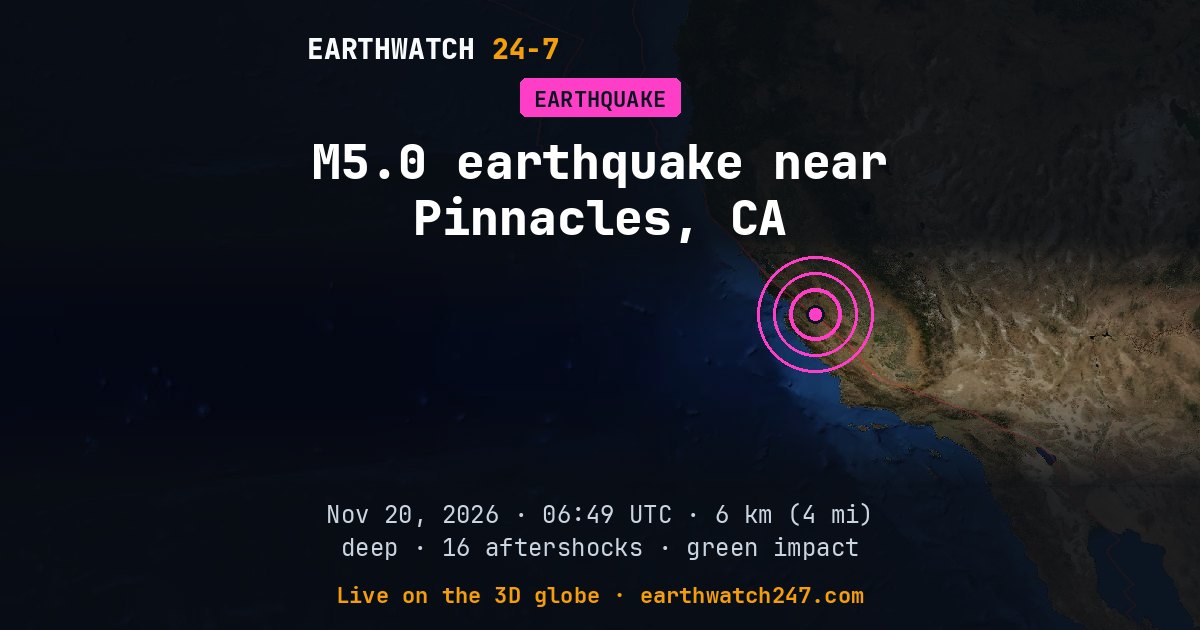
A magnitude 5.0 earthquake struck 10 km (6 mi) northwest of Pinnacles, CA on Friday, November 20, 2026 at 06:49 UTC, at a depth of 6 km (4 mi), according to the U.S. Geological Survey. Shallow quakes like this one shake the surface hardest. The nearest city of a million or more people is San Jose, California, about 96 km (60 mi) away.
USGS set its tsunami flag for this earthquake. The flag is set automatically for large earthquakes at sea and is not a warning. For official tsunami information, see tsunami.gov and your national warning center.
USGS’s PAGER impact estimate is GREEN: little or no damage expected.
Why here?
This earthquake struck about 40 km (25 mi) from the boundary between the North American and Pacific plates. Most earthquakes happen along plate boundaries like this one, where the pieces of Earth’s outer shell collide, pull apart or grind past each other. Stress builds up over years until the rock suddenly slips.
The red lines on the map are plate boundaries.
Shaking and impact
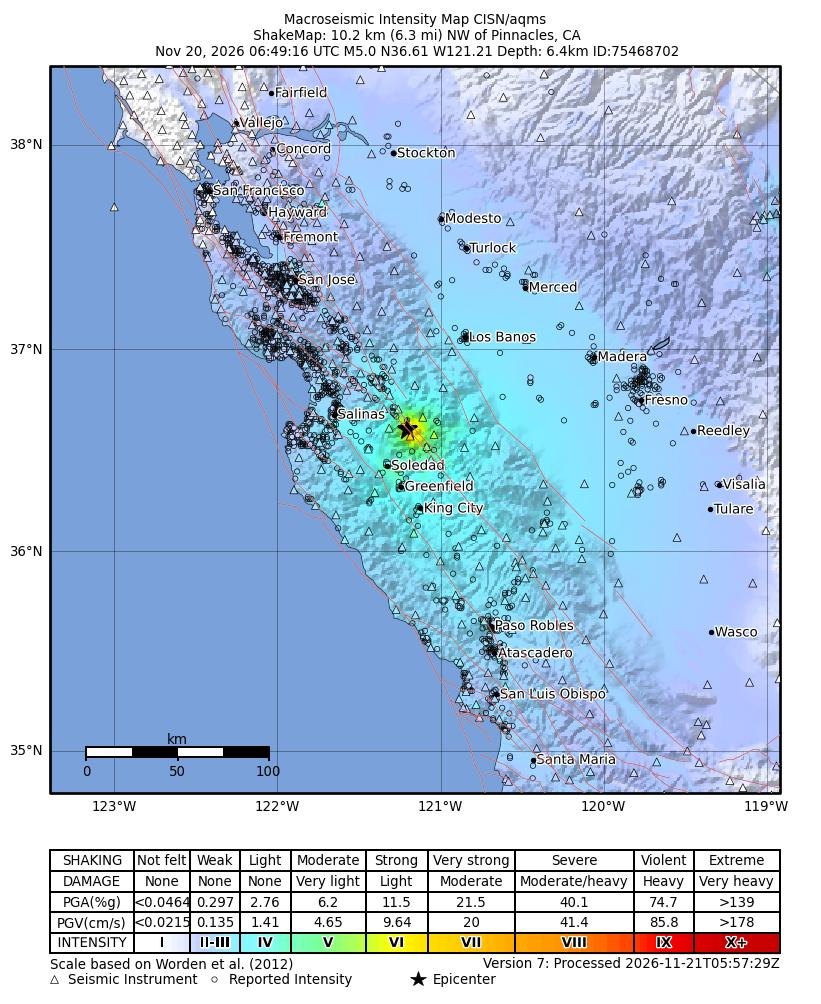
The strongest shaking USGS estimates was intensity 6 on the Modified Mercalli scale: strong. About 3,006 people were exposed to moderate shaking or stronger (intensity 5 and up), including about 14 to very strong shaking or worse (7 and up). USGS’s PAGER system estimates it most likely caused no deaths (95 percent probability). Early estimates are revised as reports come in.
Shaking map
How strongly the ground shook, as USGS estimates it from the earthquake and the seismic stations that recorded it: the colors are intensities on the Modified Mercalli scale, explained under the map.
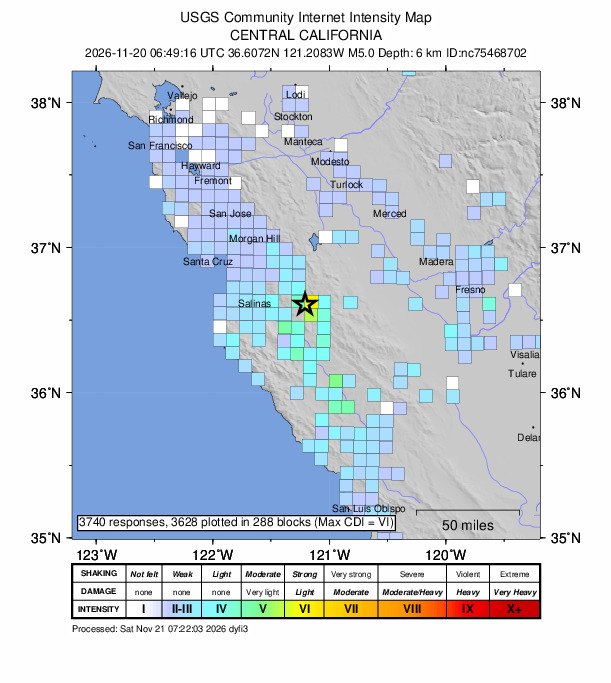
Did you feel it?
3,740 people told USGS’s “Did You Feel It?” survey they felt this earthquake; the strongest shaking reported was intensity 6, strong.
How strong was it?
Magnitude is logarithmic: each whole step releases about 32 times more energy. This magnitude 5.0 released roughly the energy of 477 tons of TNT. That is about 32 times the energy of a magnitude 4.0, a quake people nearby feel but that rarely causes damage. The strongest earthquake ever recorded, magnitude 9.5 in Chile in 1960, released about 5,600,000 times more than this one.
Aftershocks
In the first 32 hours after it, USGS recorded 16 smaller earthquakes of magnitude 2.5 or more within 100 km (62 mi). The largest was a magnitude 3.4 on November 20 at 07:14 UTC.
- M3.4 · 6 km (4 mi) NW of Pinnacles, CANov 20 07:14 UTC
- M3.1 · 10 km (6 mi) NW of Pinnacles, CANov 20 08:35 UTC
- M3.0 · 10 km (6 mi) NNW of Pinnacles, CANov 20 06:52 UTC
- M2.7 · 5 km (3 mi) NW of Pinnacles, CANov 20 07:21 UTC
- M2.7 · 10 km (6 mi) NW of Pinnacles, CANov 20 08:36 UTC
Outside the United States, USGS mainly lists quakes of about magnitude 4 and up, so smaller aftershocks there are undercounted.
The aftershock forecast
USGS’s forecast, issued : the chance of at least one aftershock of each size, counted from when it was issued. The chances fall as time passes without one.
| Size | Next day | Next week | Next month |
|---|---|---|---|
| M3+ | 28% | 56% | 67% |
| M5+ | <1% | <1% | <1% |
| M6+ | <1% | <1% | <1% |
The most likely number of magnitude 3 or larger aftershocks over the week: 0 to 4.
From USGS’s aftershock forecast. USGS issues one for magnitude 4 and up in the United States and for many magnitude 5 and up elsewhere, and updates it as the sequence develops.
Earthquake history here
Before this earthquake, USGS had recorded 29 earthquakes of magnitude 6 or larger within 300 km (186 mi) since 1900. The strongest:
- M7.9 · The 1906 San Francisco, California EarthquakeApril 18, 1906
- M7.5 · The 1952 Kern County, California EarthquakeJuly 21, 1952
- M6.9 · The 1927 Lompoc, California EarthquakeNovember 4, 1927
Official details and updates: USGS event page. The shaking map, felt reports and aftershock forecast are USGS’s (public domain).
See every earthquake on November 20, 2026 or earthquakes by day.
More from around the world
- M3.3 earthquake near San Pedro, CANov 21, 2026
- M5.9 earthquake near Yanglong, ChinaNov 21, 2026
- M5.2 earthquake near Tateyama, JapanNov 21, 2026
- M6.8 earthquake near Lospalos, Timor LesteNov 21, 2026
- M4.9 earthquake near Port-Vila, VanuatuNov 21, 2026
- Cyclone XavierNov 21, 2026
- Falcon 9 Block 5 launched USSF-317Nov 21, 2026
- Falcon 9 Block 5 launch: NROL-136Nov 22, 2026