M5.4 earthquake near Masohi, Indonesia
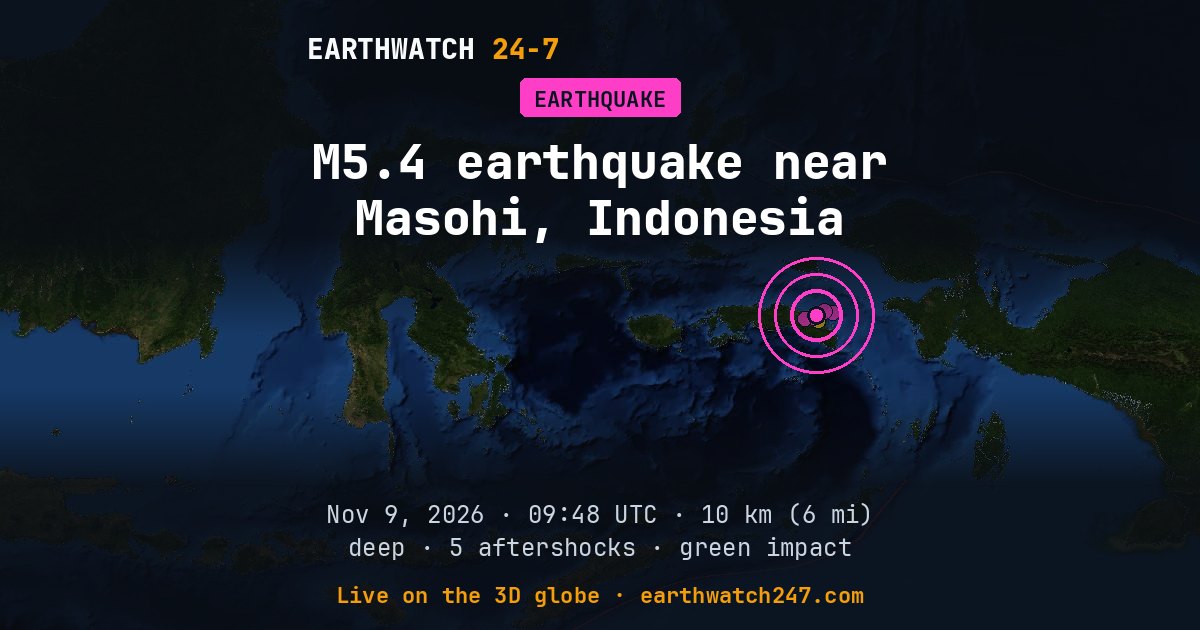
First reported as magnitude 5.2, the earthquake was upgraded to 5.4 by the US Geological Survey. Early estimates come within minutes from the first seismic stations; the reviewed figure takes in many more.
A magnitude 5.4 earthquake struck 160 km (99 mi) east of Masohi, Indonesia on Monday, November 9, 2026 at 09:48 UTC, at a depth of 10 km (6 mi), according to the U.S. Geological Survey. Shallow quakes like this one shake the surface hardest. The nearest city of a million or more people is Makassar, about 1,237 km (769 mi) away.
USGS’s PAGER impact estimate is GREEN: little or no damage expected.
Why here?
This earthquake struck about 378 km (235 mi) from the nearest major plate boundary, which makes it an intraplate earthquake. These happen on old faults inside a plate, where stress from the plate’s slow movement is released. They are less common, but can surprise areas that rarely feel quakes.
The red lines on the map are plate boundaries.
What kind of fault?
USGS’s analysis of the seismic waves shows it was an oblique earthquake: the fault slipped partly sideways and partly as one block pushed up over the other.
Shaking and impact
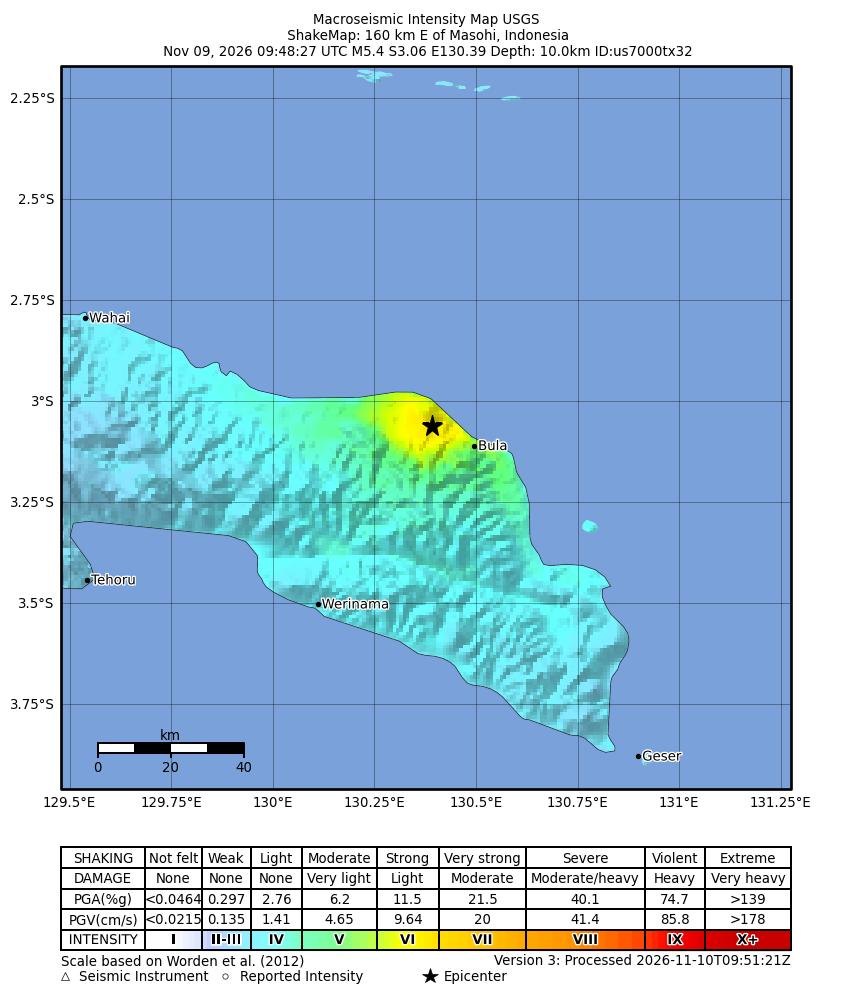
The strongest shaking USGS estimates was intensity 6 on the Modified Mercalli scale: strong. About 42,884 people were exposed to moderate shaking or stronger (intensity 5 and up). USGS’s PAGER system estimates it most likely caused no deaths (90 percent probability). Early estimates are revised as reports come in.
Shaking map
How strongly the ground shook, as USGS estimates it from the earthquake and the seismic stations that recorded it: the colors are intensities on the Modified Mercalli scale, explained under the map.
How strong was it?
Magnitude is logarithmic: each whole step releases about 32 times more energy. This magnitude 5.4 released roughly the energy of 2 kilotons of TNT. That is about 126 times the energy of a magnitude 4.0, a quake people nearby feel but that rarely causes damage. The strongest earthquake ever recorded, magnitude 9.5 in Chile in 1960, released about 1,400,000 times more than this one.
Aftershocks
In the first 6 days after it, USGS recorded 5 smaller earthquakes of magnitude 2.5 or more within 100 km (62 mi). The largest was a magnitude 4.8 on November 9 at 09:53 UTC.
- M4.8 · 183 km (114 mi) E of Masohi, IndonesiaNov 9 09:53 UTC
- M4.7 · 168 km (104 mi) W of Fakfak, IndonesiaNov 11 12:17 UTC
- M4.6 · 130 km (81 mi) E of Masohi, IndonesiaNov 11 12:10 UTC
- M4.5 · 152 km (94 mi) E of Masohi, IndonesiaNov 9 16:52 UTC
- M4.3 · 164 km (102 mi) E of Masohi, IndonesiaNov 9 14:55 UTC
Outside the United States, USGS mainly lists quakes of about magnitude 4 and up, so smaller aftershocks there are undercounted.
Earthquake history here
Before this earthquake, USGS had recorded 64 earthquakes of magnitude 6 or larger within 300 km (186 mi) since 1900. The strongest:
- M8.5 · 1938 Banda Sea EarthquakeFebruary 1, 1938
- M7.4 · 193 km (120 mi) W of Sorong, IndonesiaOctober 7, 1923
- M7.3 · 55 km (34 mi) S of Ambon, IndonesiaOctober 8, 1950
Official details and updates: USGS event page. The shaking map, felt reports and aftershock forecast are USGS’s (public domain).
See every earthquake on November 9, 2026 or earthquakes by day.
More from around the world
- M6.7 earthquake near Carhuamayo, PeruNov 21, 2026
- M4.9 earthquake near Pangai, TongaNov 20, 2026
- M5.1 earthquake near Port-Olry, VanuatuNov 20, 2026
- Tornado Warning: San Benito, CANov 20, 2026
- Tornado Warning: Merced, CANov 20, 2026
- Great Sitkin volcanoNov 20, 2026
- Kilauea volcanoNov 20, 2026
- Long March 6C launch: undisclosed payloadNov 21, 2026